|
The study of human walking has got to go back to tracking. More scientific methods involve measurement. As is the case with science, the question is what is the question? Is it about speed, length, force,
consistency, similarity to a favorite animal - what? So you get all sorts of series with 20 of these and 30 of those and 100 of this and 1000 of that. With high numbers we get deviation from normal and compare the
measurements of those we know are not doing so well with those of the group who are OK.
In recent times, ink blackened feet walking over paper gave us distances without timing. Tricks to add time marks to the foot prints allowed primitive - better than pure speculative - real measurement of who was
doing what.
 But it took a speculation backed by big money to get the
real ball rolling. Stanford (of university fame) owned a railroad when that was the biggest thing you could do. He speculated that a horse had all 4 feet off the ground when
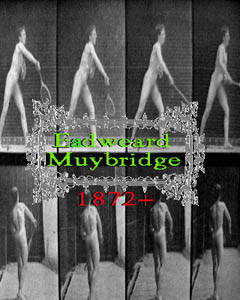
running. Nobody could actually prove or disprove that until a guy with more spellings of his name than a centipede has legs (Muybridge) came along. But it took a speculation backed by big money to get the
real ball rolling. Stanford (of university fame) owned a railroad when that was the biggest thing you could do. He speculated that a horse had all 4 feet off the ground when
running. Nobody could actually prove or disprove that until a guy with more spellings of his name than a centipede has legs (Muybridge) came along.
In the 1870s Muybridge set up an array of cameras triggered by strings which the horse hit as it ran by. Gotcha. Feet off the ground.
Big hit. Encore. A seemingly endless run of studies of motion followed, using timed camera triggers, which captured humans walking, running, climbing stairs, wrestling, playing tennis, and on and on.
Two physiologists (Braun & Fischer) in Germany (what became East Germany) did the 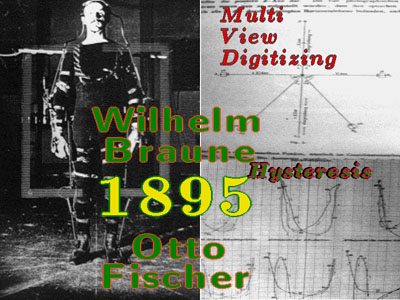 amazing real thing. Their subject was fitted with a series of light emiting gizmos which strobed to an exact
timer. It was recorded by three large film cameras as multiple exposure of light dots. By first taking data from a measured object (a 'standard' or ruler), then the superposition of the
human flashes, the dots could be triangulated into a three dimensional data set. amazing real thing. Their subject was fitted with a series of light emiting gizmos which strobed to an exact
timer. It was recorded by three large film cameras as multiple exposure of light dots. By first taking data from a measured object (a 'standard' or ruler), then the superposition of the
human flashes, the dots could be triangulated into a three dimensional data set.
They not only put forth all sorts of 'normal' human walking data but even made a 3D model of stick (real wooden sticks) figures from the data which could be viewed as you would any real model.
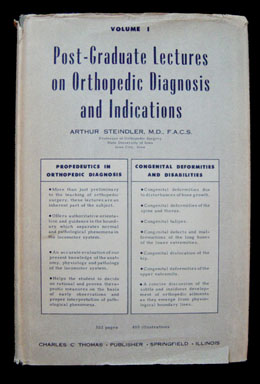 This data mysteriously got quoted extensively in the orthopaedic literature as walking specs with decimal places, illustrated, with nearly no mention of how that
data originated, nor from where. This data mysteriously got quoted extensively in the orthopaedic literature as walking specs with decimal places, illustrated, with nearly no mention of how that
data originated, nor from where.
How? An American orthopaedic student studying in Germany brought it back and became a department head and wrote a book. Braun and Fischer are noted but without even a clue as to how all that data came to be.
This book author rose to great heights while Braun & Fischer kind of slid into the who-izzat realm. Even so the data in this volume came to be second hand gospel.
Totally true and mysterious in origin. The original Der Gang des Menchens (in German) had to be rediscovered in a huge uncataloged library in East Germany after the Berlin Wall came down.
A look inside the lecture series book I:
But practicality was at work here. Steindler was not about to repeat those methods. Aside from teaching and passing it on, what good are normal measurements, anyway, if you can't measure the
abnormals? The study methods of Braun & Fischer were brilliant but difficult. You might pull it off if you spend a fortune and get a rare cooperative subject who could wear the outer space gear.
Mmmmm? It was a start.
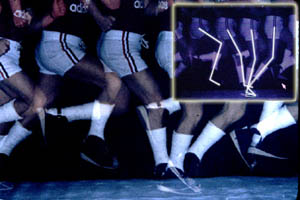 Strobing lights allow ordinary still film to capture
movement. Strobe fast enough and the room seems to be lit. Or strobe a specific color and use a camera filter and you can use a slower strobe in a color lit room which won't expose the film. Strobing lights allow ordinary still film to capture
movement. Strobe fast enough and the room seems to be lit. Or strobe a specific color and use a camera filter and you can use a slower strobe in a color lit room which won't expose the film.
This is actually pretty good. We relate very well with these images. A bra commercial is probably still remembered by many - she dreamed she went dancing in her Maidenform Bra. The >dancing<
either requires a series of images ala Muybridge, or multiple exposures in a single picture ala the strobe light. By taking tracings, we can also generate real data.
These are strobes done by me and you can be assured that such measurements take forever to abstract and crunch. You have to really want that measurement. Still not practical for day to day measurement - but 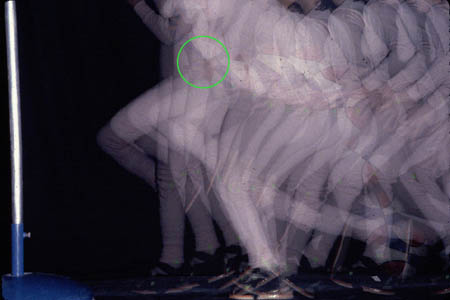 quite satisfactory for the discerning eye. quite satisfactory for the discerning eye.
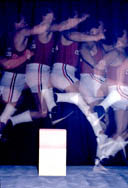
Here we see a young lady wearing a white body suit dribbling a (red white & blue) basket ball into a layup shot.
The basket is up on the pole.
Yes, she has two casts on her feet. Yes, we were able to study how to offset loss of motion by casts allowing the subject to do all sorts of stuff - using simple
strobe light photo studies. Strobe plus Polaroid instant film, voila.
 Studies of not just normal walking but complex activity are possible at very
low cost if you are willing to trust the skilled eye. On the left, a large array of shoes rigged in all sorts of ways were tested for walking, speed running, and
jumping hurdles. The, then, supposed corrective cast shoe (rocker bottom) failed miserably. The data measured earlier by Inman (by a high end method)
aimed at prosthetics for amputees turned out to hold all the correct answers. Studies of not just normal walking but complex activity are possible at very
low cost if you are willing to trust the skilled eye. On the left, a large array of shoes rigged in all sorts of ways were tested for walking, speed running, and
jumping hurdles. The, then, supposed corrective cast shoe (rocker bottom) failed miserably. The data measured earlier by Inman (by a high end method)
aimed at prosthetics for amputees turned out to hold all the correct answers.
 So how was that kind of data arrived at
? Well, a combo of high tech and brute force grunt labor. So how was that kind of data arrived at
? Well, a combo of high tech and brute force grunt labor.
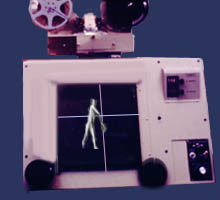
When Sputnick freaked out the Western Military, the thrown together Vanguard Rocket program failed terribly, but did produce this rear projection film viewing device. Note the two
round knobs at the bottom which - like an etchasketch - move two cross hairs which generate, frame by frame, very high precision points of interest over the projected image of the
Vanguard Rocket blowing up on the launch pad. The cameras were high speed and could suck a full movie sized roll of film to nothing in a few seconds.
Well if you point those cameras at a person, not exploding, but doing something like walking - A N D - if you can get a resident to go blind looking at frame after frame and turning those knobs and pencil
logging the x and y data (7 decimal places), and then doing the math, then before that subject departs this earth in old age you get to know the data. Well the orthopaedists were cheating and looking as
well at the film as a step through. Data came later. This was the California contingent of Inman and his followers, and Dr. Sutherland, and the Ranchos Los Amigos group who generated quite a bit of data
on stroke patients as the first order of business after prosthetics.
 Real findings were emerging and real strategies of
what to look for. We were learning what the questions were. But the methods of data aquisition were still brutal. Real findings were emerging and real strategies of
what to look for. We were learning what the questions were. But the methods of data aquisition were still brutal.
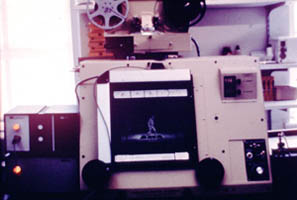
On the right, the Harvard-MIT team of the RERC (Research Engineering Rehabilatation Center) took the California idea and altered the cameras. The cameras were computer step driven to allow
variable speed and longer sessions.
Vanguard knobs and cross hairs were decomissioned. Two ultrasound microphones adorn the top and left side of the viewing screen and send data to the boxes on seen to the left (with the orange
lights). They send sound delay data from the (mouse) probe sitting at rest on top of the top microphone. When you click the mouse button an ultrsound squeek is detected by the two
microphones. Where the click came from is sent to the computer which steps through menus of expected named points. The two white strips are divided into boxes of command locations (menus)
which allow the user to alter the data flow or skip unseen points. The computer advances the frame of film at the end of each series of points.
It computes missing data from the entirety of the data. But the 7 bit word of the computer at that time could not do everything required. So.. the MIT students took it apart and added an eighth bit. No
kidding. There was an unused bus line. The computer reps went goony when they saw that.
The 8 bit word was now in action. More rapid data aquisition allowed actual patient data to solve actual ongoing problems (they were calling us for results the night of the study). There was also
"EMG" data acquired and "force plate" data time coupled to the motion data.
In addition human evaluations of things (heel strike, toe off etc, and any non motion event such as a grimace) were logged into the data base. Mathematics know-how came from advertising tech (rolling
logos) and from the Smithsonian Astrophysical Observatory (tracking unseen orbit centers) and from the competing dormatories of the MIT engineering and Harvard math students and me who made the
rounds of these folks. Everybody did something. This was before "Intellectual Property" and the death of explosive technology.
By the way, the force plate was built by an MIT professor who wanted to measure the kick of race horces leaving the gate. Science. A weird guy who would whack the force plate at odd intervals with
the wide end of a crutch, brought it to high levels of intelligence.
But this system was still based on film. Film needs to be developed. What'ayamean the film was ruined? Mmmm. Do we really need 1000 frames per second. Simulations of lesser samples culled
from the densely sampled files showed that filtering could drop our need (for walking) as low as 20 frames per second without much loss.
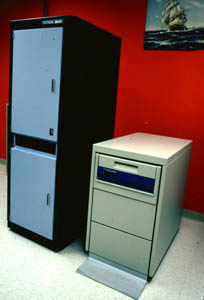 Computers were getting meaner and data recording more vast.
The Gould multitasking real time data aquisition built primarily for military and nuclear physics (nuclear reactor) control was the next step. The USMA (US Military Academy) 4D modeling software
only needed data from anything physical to do all the rest. That, and some rules and terminology. Computers were getting meaner and data recording more vast.
The Gould multitasking real time data aquisition built primarily for military and nuclear physics (nuclear reactor) control was the next step. The USMA (US Military Academy) 4D modeling software
only needed data from anything physical to do all the rest. That, and some rules and terminology.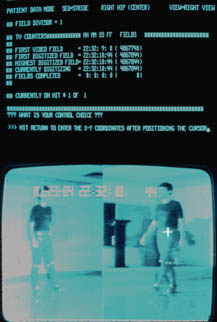
Front end was video input. We (in New Jersey now) had built for us, by a firm in Texas, a box which could track a point in video and output X-Y coordinates.
With a little help from our friends (Rutgers Aeronautics Dept, AT&T, Bell Labs, and some awesome brains at EAI who program in pure binary on these machines) we had us a real
time analytic machine turning out conclusions. Conclusions. They were in physics form but still with real world meaning, not just lengths or intervals.
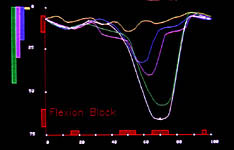 We wanted to know
about the way the broken nervous system works. Not how it fails but how it gets by. We wanted to know about compensatory mechanisms. What do you do when something doesn't let you do it right? We wanted to know
about the way the broken nervous system works. Not how it fails but how it gets by. We wanted to know about compensatory mechanisms. What do you do when something doesn't let you do it right?
The aeronautics folks helped us construct nasty things to wear to mimic certain kinds of restraints through a series of degrees of badness. What did the subjects do to get around the constraints?
We published only a tiny bit of our findings as nearly no journal could handle the data (2 foot wide paper, tight print, 300 pages of crunched data). It took many self written programs to wade through it
all to get human interpretation of what we were seeing. A tight subportion of the data was published in Clinical Orthopaedics and Related Research. We conveyed the findings of the actions of the
unconstrained side when one leg had a series of constraints. What the unimpeded side did, wich was not "normal" was paliative to our devices. How so was the subject of that report.
Interestingly, though we learned much about constraints, the data did not in any case resemble cerebral palsy. Three hundred dense pages of outcome data without a trace of anything looking like
palsy. Range of motion is not the key factor in cerebral palsy. Not even close. Yet our terminology is nearly nothing but range of motion this and range of motion that.
It was time for mathematical models. Made many. But still no clue.
It took a smaller computer (a multitasking desktop) that could be reprogramed at will, often on a whim, to give the flexibility of asking what questions were not being asked, to nail down the real
factors. I used an Amiga genlocked to a double video source with EMG converted from the usual strip chart (looked at separately) to bar graphs bouncing up and down in the actual video - real time
video insertion thanks to a video delay loop in the acqisition mechanism and using a telemetry based on Macintosh architecture.
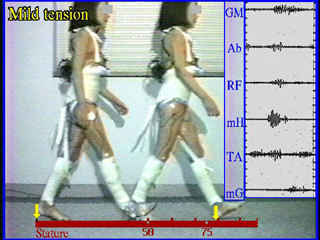 You could see, perceive, what was causing a
subject to look like CP. It wasn't limited range of motion. It was retardation of momentum. It stood out. But to get EMG strip chart verification and to solve another problem, we took our desk top system to Hershey at Penn State University and borrowed their gait lab, inserting our stuff in line with theirs. You could see, perceive, what was causing a
subject to look like CP. It wasn't limited range of motion. It was retardation of momentum. It stood out. But to get EMG strip chart verification and to solve another problem, we took our desk top system to Hershey at Penn State University and borrowed their gait lab, inserting our stuff in line with theirs.
The other problem was that each time we tried to retard momentum in our volunteers, we nearly killed them. Our EMG was not able to be read as it topped out. Even swapping the
linear input chips for logrhythmic, which ought to measure anything, was not enough. Our subjects were on the floor, pursed lip breathing, holding their chests and asking to stop. Ahhh. We had it! Just
needed an indestructible subject who could do the full range of tensions which we thought were present in the range of children with CP. Oh, notice that the computer handling of video allows
superposition such that we also get our strobe effect. The human eye and what is behind it likes that.
We had also learned that inches or meters mean nothing. Lengths expressed in terms of body height (height = 1 stature) blessed us with very easy to grab and hugely applicable measurements. We
learned that measurements must be in tune with what you are observing. It is relative to mass and proportional lever lengths. The horizontal red bar (above) marks off distance in statures. Here the
stride length is 0.78 statures. The EMG and graphs look nearly normal despite mild tension. Nearly. The nearly was the first insight to strategy number one. Make the tension go away. See the study of elastics for the rest of this.
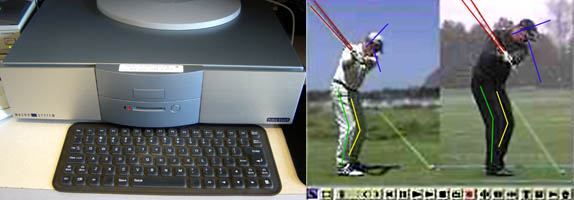 |
There are now desk top commercial devices which can record video from two sources and allow user inspection and measurement taking. It's those danged golfers. What is it with golf? Everybody wants
to analyze golf strokes. Then, when the product does not get a big golf following, it goes belly up. Here is one that has hung in there, Video Coach, from Draco, the Casablanca video editor company,
does all the needed stuff to look at motion and check out details. It wasn't built for gait, but all the analytic tools are there.
We are currently using BioGait, an offshoot of SportsCAD reworked for walking disorders. We like this one in particular because it can go on any laptop and use your video camera or two of them. It is
especially suited to laying out meaningful sequences and taking data for notes.
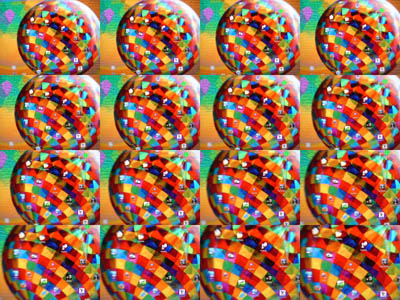 The Sony Cybershot DSC-T1 is a slim shirt pocket 5 megapixel still camera. On the multiburst setting, a single picture file is
recorded. However, the image is divided 4x4 such that 16 sequential images are contained in one composite image, checker board like. The camera viewer shows only one of the 16 subportions at a time in sequence
in slow motion or you can step through one by one. As the camera viewer normally only shows 0.25 of the full image resolution, the play back does
not appear diminished. In essence rather than a single full sized 5 megapixel image, the 1/4th sized image that would normally go to the camera's view screen is diverted, as is, to the image file 16 times
in sequence. A whole world of function in a shirt pocket motion lab. The Sony Cybershot DSC-T1 is a slim shirt pocket 5 megapixel still camera. On the multiburst setting, a single picture file is
recorded. However, the image is divided 4x4 such that 16 sequential images are contained in one composite image, checker board like. The camera viewer shows only one of the 16 subportions at a time in sequence
in slow motion or you can step through one by one. As the camera viewer normally only shows 0.25 of the full image resolution, the play back does
not appear diminished. In essence rather than a single full sized 5 megapixel image, the 1/4th sized image that would normally go to the camera's view screen is diverted, as is, to the image file 16 times
in sequence. A whole world of function in a shirt pocket motion lab.
So let's make a distinction. Gait analysis is not what a computer does. It is what you do. Use the tools at hand to record observations and then take those measurements which help. Typically the visuals are
99% of insight. The measurements are 25% of explanation.
|