
Walking.
Deep Theory!
(very deep)
 Why? What is so troubling to those of us who have put so much time into dogged study of walking
disorders is how little all that study has served us. There is much more clinical practice derived from hands-on experience (picture Wiley Coyote after the Acme Bomb Kit , blows up in his face) than from
real predictive science. The gurus of the field may very well be soot laden. We like to, well I like to, deride those who professed the old wrong theories. Really, fire, water, air and mmm
what's the fourth - pine cones? Something as silly.
Why? What is so troubling to those of us who have put so much time into dogged study of walking
disorders is how little all that study has served us. There is much more clinical practice derived from hands-on experience (picture Wiley Coyote after the Acme Bomb Kit , blows up in his face) than from
real predictive science. The gurus of the field may very well be soot laden. We like to, well I like to, deride those who professed the old wrong theories. Really, fire, water, air and mmm
what's the fourth - pine cones? Something as silly.
But the wrong theory is important. At least it takes naiveté and tacks it down somewhere, makes it a target. Argument follows and the prize goes to the one who can show where the stated theory is wrong. The scope of ignorance gets successively narrowed.
This page will set forth some of the laboratory observations we have made in our humble practice over the last twenty plus years and then propose an outrageous theory to tie it all together along with insights or misconstructions that draw heavily on the entire field.
We start with normal children and impair one leg each by using braces.
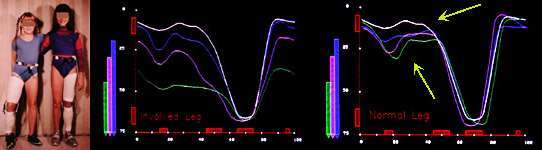
Children Braced Leg Knee Motion Free Leg Knee Motion
In the experiment, movement is supple, but stopped at some point by motion limiters in the brace hinges. What we see when we progressively limit the range of motion to which the knee can extend (like an abrupt flexion contracture) is that the child walks more flexed in BOTH legs. The free leg motion is NOT "normal". Looking at the graph on the right we see the "abnormal" process and know - by straight forward logic - that this is compensatory. But how so?
Both legs strive to preserve what can be preserved of the pendulum (the big U shaped dip). Somehow that is important. Logic again. As both legs are attached to the same body, they must travel the same distance over a span of time. Does symmetry of movement help sustain transfer of energy from one leg to the other? How does a shorter (more flexed leg) maintain similar pendular movement? Do other things change? [yup]
But consider this variation: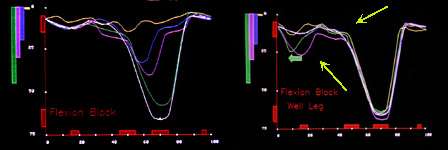
Braced Leg Knee Motion Free Leg Knee Motion
A knee blocked from flexing (left graph) still tries to preserve the pendulum even though constrained from doing so. The free leg (right graph) alters the stance phase in amplitude
AND in timing. Stance flexion comes sooner (shifts left). A plateau before the deep dip of swing flexion has a decided wobble in it. [That turns out to be the ankle-foot
mechanism doing an unexpected fill in thing]. Why? The four kids (two boys and two girls) were kept walking for hours. This is what they resorted to. This is what worked.
Well, make a long story short, the swing of one leg has to match the stance of the other and energy transfers have to be timed the way a baton is passed in relay races. Otherwise walking becomes awful, a severe energy drain.
Given constraints, a new strategy had to be used to get efficiency. The strategy was to reign in the well leg timing to the best mechanics of the fettered leg. That fettered leg did some very interesting things such as toe walk. There was body sway, and in the worst circumstances, both legs used very short arcs of motion - short steps. Short steps are the common abnormality of many real pathologies. But here, short steps were a solution, not pathology. Hmmm.
Let's bugger the pendulum. We will allow range, per se, but apply elastics that retard motion through the full arc. We will test mild, moderate, and severe circumstances. Mild restraint does not reduce the combined hip flexion + knee extension. Moderate impairs the final range of either hip or knee range tested separately. Severe constrains both no matter how tested. We will use 11 levels of testing to get a handle on this. And we will also destroy two volunteers in the process. OOPS. It sounded easy enough. This actually parallels the range of restriction that we see in our CP kids, who seem to get along with the deficits. They DO like to be carried, though.
Volunteer #1, an adult male in decent shape, plays weekend basketball, was rendered unable to get off the floor by trial 6. He resorted to bunny hopping across the lab to get to the starting point, chinned to standing using the door frame, then did a running falling burst when told to "go", landing face down past the infrared timing beam, occasionally going under it. Quitting at session #6, he was unable to regain his normal gait the rest of the day (he was recovered by the next day).
Volunteer #2, in his late 20's, a regular marathoner. He got to trial level #8 and pooped out like volunteer #1. Two experimental failures? No. We were looking at extreme energy mechanism damage. That may be the most telling fact of all.
Volunteer #3, a 9 year old girl, competition Irish step dancer. If she poops out we give up. Well, with plenty of cola, orange slices, pizza, water on the fly, and money (lots of money) and refusing her pleas to end the tests, she finished. We had to move our lab equipment to another lab in another state in order to remedy the problem that was evident in the other two attempts. EMG levels were so high, that our equipment couldn't measure it. The other lab had an old polygraph like device in line -old but good, as it could dial down the electrical gain by 1000 fold. We needed every bit.
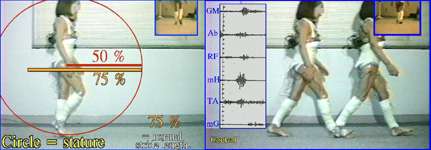
Here she is, walking as a control. There is a rubber/nylon fitted corset glued to her as well as a shin sleeve (also glued). It's medical glue. Her walk before this was identical.
The glued material allows elastics to be run from one place to another. The elastics were pretested for strain versus length etc.. On the right is a superimposition stride with an
inset of EMG (electrical activity of different muscle groups sent by telemetry to our receiver then through the guest lab's system to the final output. The inset image is a
front/rear view (also recorded separately). There are pressure sensors on her feet under the great toe and fifth toe metatarsals and under the heel. No joint is impaired by the devices. Only elastic straps will impair.
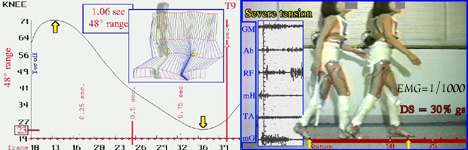
Graph of Knee Motion +Sticks One stride + EMG at 1/1000
By trial 4, the EMG activity was a wall of black. Progressively, the amplitude was dialed down to this final limit. At 1/1000 amplitude we see that nearly everything sampled is
putting out great muscular activity. The activity is of high amplitude and long duration. Typically, any single muscle is only briefly on and then mostly off during one walking
cycle. Picture yourself pushing a kid on a swing: brief push then you wait as the swing goes away then returns, then another brief push...
___/\/\/\/\/\____________/\/\/\/\/\_______________
But that normal pattern of short bursts becomes
/\/\/\/\/\/\/\/\/\/\/\/\/\/\/\/\/\/\/\/\____/\/\/\/\/\/\/
Muscle gets blood flow when it is at rest, under low tension. Not only does high effort use more fuel, there is less time to clear out the spent products of metabolic combustion.
Notice that the elastics go from ishium (tush area) to the front of the knee (same as one of the hamstrings). Her gait becomes stiff with very little knee motion in (48 degrees, nl
= 75 to 80). We see electrical patterns typically called dysphasic and cocontraction.
We see the short stride length once again. We see toe walking! Hard to see in this view
but clear in the frontal, about 40 degrees of inward leg rotation and there is a definite crouch gait. It looks like spastic diplegia.
Something compensatory is going on. But what?
Let's look to the past.

With the earth at the center of the universe, calculating where Mars or Venus was going
to be was a chore. The clock makers made these very many gear astrolabes. You crank them and many gears went around and simulated the planets and sun traveling around
the earth. It takes a lot of gears to be wrong. Cycles and epicycles of gears of very many sizes in complex trains were costly to make.

But, if you change the assumption, and place the sun at center, you get a simplicity
centered model. How many gears are needed to predict 3 planets? Three. Get it? It is easier. It was at first called a mathematical trick, a shortcut, but the simplicity screamed truth.
You can use iron, brass, and bronze and turn gears or do the mathematical equivalent and string together a series of circle equations (c2 = a2 + b2). Before Copernicus, you
needed two circle equations for every epicycle. Chances were, you could wait for Mars and get the answer before you finished all that epicycle math. Thank goodness they didn't
have computers!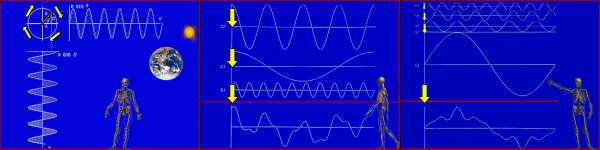
Sine waves are math plots following a point on the edge of a turning circle. Seen from two angles we get sine and cosine (left image). The sine wave size reflects the wheel size (amplitude). The quickness that the graph comes back to its starting position represents the time required of one full turn (period). We can describe all that data in two numbers, wheel size and speed. What it says is this, take a wheel so big and turn
it so fast and you will trace out that curve. The two numbers (size and speed) are called coefficients. One pair of coefficients = one wheel (or gear).
In order to crunch data (compress billions of data points into fewer) you can do a trick invented by a fellow named Fourier. See middle image at bottom. That oddball curve can be best matched with a sine wave of approximately the same size (area). It won't fit exactly unless it were the graph of a single turning wheel. You take the best fit wheel data and subtract it from the actual curve to create a what's-left-over curve. That new curve is smaller in size. So, fit another best match smaller sine wave. The next left over curve is even flatter.
Pretty quickly you derive a series of wheels (pairs of numbers representing wheel size and speed of turning), that when added together yield the curve to be matched. A very complex line of no apparent rhyme or reason will get fitted eventually. So, some very complex line may require 30 coefficient pairs (30 math wheels) to duplicate its data. Thirty coefficients is nothing compared to the billions of data points required to report the complex curve directly as x,y => x,y => x,y => x,y =>...
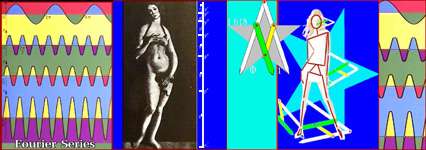
Back in ancient Greece, the architect who designed the Parthenon, a fellow named Phidias, was struck by a shape relationship we now call the golden proportion. It is a line length to second line length that when subtracted, the difference is a length in same
proportion to the original shorter as the shorter was to the longer. But, that's not how he came by it. According to Phidias, and he should know, he took it from the proportions
of "women pleasing to my eye". It's human!!!! The proportion 1.618 is a human limb proportion pleasing to the eye. Why? That is - why is it pleasing? Are we programmed
to prefer it? Is there something essential in that number value?
You bet. The five point star can quickly construct a caliper that strikes out golden proportions. Botticelli and many old time painters went to extremes to include that proportion in their works. It is everywhere. Artists know it cold. So why do we have that proportion? One thing about that proportion, it is the ratio you get when you divide out the Fibonacci series (each number is the sum of the previous two). That ratio may well be the most reentrant number there is. That is, you can do all sorts of combos of the parts in the series and fit all sorts of stuff with the least number of units and get back to the start with nothing left over. If you had all gears of the same size, you couldn't fit anything at all except the data of a gear that size. Curve fitting requires size steps in a series of wheels (or circle equations).
An example of efficiency. We had a mainframe storage device that was very expensive and totally filled with patient and experimental walking data. Choice: 1: Spend $100,000 to buy another. or 2. Fourier the data and just save the coefficients. Easy. Choice two. Result? Better than 1000 to 1 data reduction with no loss we could measure!! We got the entire drive back! That was too good! How? It contained gait data on every kind of weird and nasty gait and experimental goobering we had. In short we found that all gait, normal AND abnormal could be summed in six numbers. Six!
But what size steps could we use? There are all sorts of number series. Squares. Cubes. Doubles. Triples. Pi. So many... If you use gears sized in Fibonacci series, you don't need so many to fit most things. It is efficient. So rather than use Fourier's arbitrary unbiologic math way of selecting wheels and speeds to fit a line, what if we just select from a limited preset set of sizes. That set is in Fibonacci series relationship, as are we.
Back to Copernicus. Is that simplification a lucky math break or does it reflect something?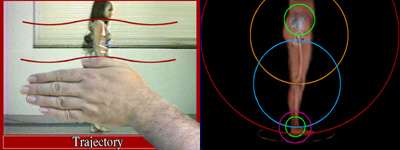
It doesn't reflect anything.
--- just kidding --- Of course it reflects something! The image on the left shows a trajectory (low amplitude sine wave). That is the way we walk. The ground below is a straight line. Can we connect the ground below (x-axis) with the trajectory above (sine wave) through some mechanism?
Look to the right. Think of the femur (thigh) as a spoke of a wheel whose center is the hip. The tibia (shin) is a spoke of a wheel whose center is the knee. The forefoot is a spoke from ankle center to metatarsal heads (ball of foot). There is a small heel wheel. There is a wheel whose center is our center of mass (just in front of sacrum) and whose periphery is the hip. Wheels. Gears. Connected. But what if we STIFFEN the knee? That generates a new larger wheel (hip to ankle). If we flex the knee, then stiffen? Add a stiffened ankle? What position? Ankle position shifts the phase? Phase shift? !!!!!!!! Bingo. This is the math of walking.
There are small harmonics (small wheel arcs) and large harmonics (large wheel arcs). If small harmonics are eliminated, larger can not simply replace them. We need another strategy. One is to generate a very large single wheel (stiffen knee and ankle) and center it so that the arc of motion is centered over a single ground point (point foot down - toe walk) and use a short arc as that is fairly level (not much rise nor fall) and the pendulum property can be matched fairly easily by the opposite limb - a short stride length with stiff parts (muscles do the stiffening - so concontraction is seen in EMG).
Does it work as math?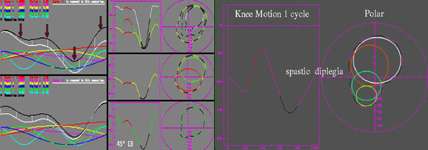
Yup. Left are Fibonacci segments in a pure mathematical simulation used to generate fits to real pathologic gait data. On the right the curve fitting is plotted in polar form which
allows better inspection of the elements contributing to periodic motion. The entire range of gait pathologic and normal can be duplicated by this means. What we see is best fit
along an intended path not just pathology. A person suddenly off balance by a push may flail the arms. There is nothing wrong with the arms.
The key is that if there is pathology to walking, there still is WALKING. Bipedal WALKING of any kind is a phenomenal talent shared by very few species. No matter how injured, if you see walking, something is working! You have to be able to do this math. You need to quickly sense what combinations to join to get the fit, especially so when the real world ground is not level. Anticipation is important.
We not only send out signals to muscle to do a certain thing but we also simultaneously send out adjustments to the peripheral sensory devices to quiet them to the changes that ought to occur. >>OUGHT<< to, expected to occur, an anticipated result. If it goes as planned the sensory device is silent. If reality does not match expectation then REFLEX arcs react to the output of the sensory paths to bring the result toward the anticipated level. That's very fast. Fast, yes. It also carries a risk. If the result is soooo very unexpected and not able to be adjusted we might just way overshoot (the injured shoulder from picking up an empty suitcase that was assumed to be very heavy, the calf injury from the one more unsuspected step on the stairway, etc).
There is another level to this. Math problems with multiple variables do not have single
solutions but rather a distribution of solutions. In this arena the solutions can be plotted as a hysteresis graph (a thick S-shaped area) on a graph of stability versus energy efficiency. Steppers - walkers.